Total Intensity: The plugin Intensity_Ribbon calculates the total intensity in a "ribbon" of user-defined width along the arc length of the leading edge for a selected image stack. Like LE_Velocity it requires a snake file generated in JFilament to indicate the position of the cell's leading edge. Also, like LE_Velocity, it maps contours to polar coordinates. When Intensity_Ribbon is run
it will prompt the user to input necessary data:
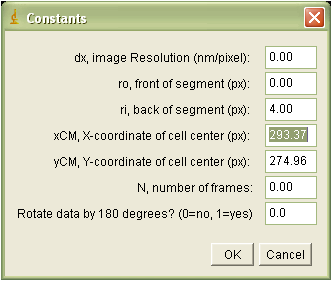
The required parameters are:
dx: image resolution, measured in nm/pixel.
ro: the distance from the leading edge to the outer boundary of the lamellipodia section to be measured (negative values are outside the cell)
ri: the distance from the leading edge to the inner boundary of the lamellipodia section to be measured (negative values are outside the cell)
xCM: the x-coordinate of the cell center, measured in pixels
yCM: the y-coordinate of the cell center, measured in pixels
N: number of frames in the stack
Rotation, which allows the user to rotate the angles of the ouput by 180 degrees. (Useful for sections of cells.)
The user is then prompted to choose a snake file.
Outputs:
Data file: The file contains a matrix of intensities
of dimentions N x 360. The
x-coordinate of this matrix indicates the frame number, while the y
coordinate of this matrix indicates angle. The total intensity is
measured in intensity units of original image. The plugin does not subtract background
intensity.
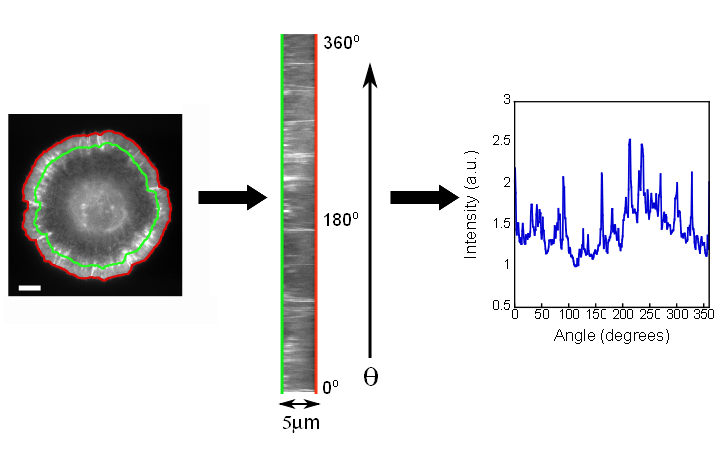
Image stack: The
generated stack of 'ribbons' of lamellipodia displays Intensity as
a function of angle and distance from leading edge, for all time
frames. Below, an example is shown where the outer and inner
boundaries
of the measuring 'ribbon' of lamellipodium are drawn in red
and green, respectively.
Intensity_Profile: The Intensity_Profile plugin calculates the intensity as a function of distance from the leading edge for a selected image stack. Like Intensity_Ribbon it requires a snake file generated in JFilament to indicate the position of the cell's leading edge, and maps contours to polar coordinates. When Intensity_Profile is run
it will prompt the user to input necessary data:
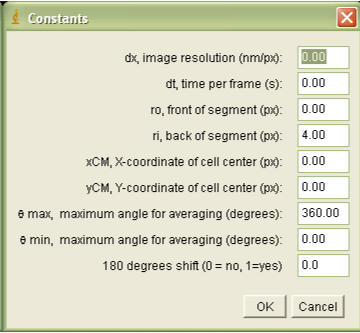
The required parameters are:
dx: image resolution, measured in nm/pixel.
dt: time per frame, measured in s.
ro:
the distance from the leading edge to the outer boundary of the
lamellipodia section to be measured (negative values are outside the
cell)
ri: the distance from the leading edge to the inner boundary of the lamellipodia section to be measured (negative values are outside the cell)
xCM: the x-coordinate of the cell center, measured in pixels.
yCM: the y-coordinate of the cell center, measured in pixels.
qmax: the maximum angle over which to average data, in degrees
qmin: the minimum angle over which to average data, in degrees
Rotation, which allows the user to rotate the angles of the ouput by 180 degrees. (Useful for sections of cells.)
Once the user inputs these data, Intensity_Profile
will prompt the user to choose a snake file.
Outputs:
Data file: The file containing intensity measurements
as functions of time, angle, and distance from the leading edge. The
data is formatted in columns that provide: time(s), angle (degrees),
distance from the leading edge (µm), and intensity. The plugin does not subtract background intensity.
Image Stack: The intensity
of each pixel is the average intensity calculated over the provided
range of angles. The y-position of each
image in the stack indicates the distance from the leading edge, and
each frame is a different time.
References:
G. L. Ryan, N. Watanabe, D. Vavylonis,
"Image Analysis Tools to Quantify Cell Shape and Protein Dynamics near the Leading Edge," Cell
Structure and Function (2013).
G. L. Ryan, H. Petroccia, N. Watanabe, D. Vavylonis,
"Excitable Actin Dynamics in Lamellipodial Protrusion and Retraction,"
Biophys. J. 102:1493-1502 (2012).