


EMI 2022
The national conference of the Engineering Mechanics Institute is back in-person and the team takes it by storm.
[June 2022]
A delegation of seven team members attended the 2022 National Conference of the Engineering Mechanics Institute, hosted by Johns Hopkins University in Baltimore, MD. They attended committee meetings and delivered seven presentations on research spanning catastrophe modeling, topology optimization, random field calibration, and data-driven methods, and much more.
Optimal Generation of Multivariate Hurricane Intensity Maps Using Hazard Quantization

The Hazard Quantization (HQ) method was developed for the effective sampling of hazard intensity measure (IM) maps with a single intensity measure. However, this method cannot be applied to the optimal sampling of multiple intensity measure maps with very different stochastic properties such as maximum wind speed and storm surge levels, which are the two most critical intensity measures for a hurricane event. This paper first introduces a novel algorithm that extends the traditional “Functional Quantization by Infinite-Dimensional Centroidal Voronoi Tessellation” (FQ-IDCVT) to the quantization of multivariate fields. Then, a multivariate approach to HQ is proposed based on the new algorithm and is tailored to the optimal sampling of hurricane events.
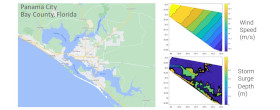
A case study on the Florida Panhandle region is presented. The sample space is represented by a large set of pairs of IM maps for wind speed and storm surge levels, with each pair representing a specific hurricane event. The simulated pairs of IM maps carry the stochastic characteristics of the associated hurricane events, such as the cross-correlation between wind speed intensity and storm surge levels at different sites of the region. The proposed multivariate HQ method is implemented to generate a reduced set of maps representative of the whole sample space. The ability of the proposed multivariate Hazard Quantization methodology to provide an accurate estimation of the hazard curve for both intensity measures and to correctly capture the spatial autocorrelations and the spatial cross-correlation among the two intensity measures is investigated quantitatively. A building portfolio loss assessment is performed for the study region, and a quantitative comparison is made between the loss computed using the entire sample space and using the reduced set of samples. The results demonstrate the accuracy of the proposed method for its application to regional loss analysis.

Liyang Ma, Daniel Conus, Wei-Min Huang, Paolo Bocchini.
Optimal Generation of Multivariate Hurricane Intensity Maps Using Multivariate Hazard Quantization.
In Proceedings of the 2022 Conference of the Engineering Mechanics Institute, ASCE, p. 379, 2022.
Wind Load Coefficients of Telecommunication Towers and Microwave Antenna

Telecommunication towers are designed to withstand strong winds and preserve the functionality of the attached nonstructural components (i.e., microwave antennas). The microwave antennas can be located at any height along the tower and are attached to the main members (i.e., legs) of the tower. These antennas modify the airflow and accelerate it around the tower in most cases, depending on the wind direction. Thus, the wind loads will be increased due to the interaction between the antenna and the tower. Design codes do not address this interaction explicitly, only by means of safety factors. Previous studies have performed wind tunnel tests in order to compute the wind load coefficients accurately. Unfortunately, experimental studies are time-consuming and their results are difficult to generalize to different tower configurations.
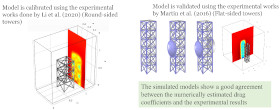
This paper provides a parameterized and straightforward protocol based on computational fluid dynamics (CFD) analysis for expedited efficiently estimation of the wind load coefficients (drag and lateral coefficients) for a lattice steel tower with a cylindrical antennas. The Spalart-Allmaras turbulence model is adopted in this study because it is relatively stable, shows good convergence, and has moderate resolution requirements. Moreover, the Spalart-Allmaras model provides a robust solution to air flow estimations close to the air cell boundary (wall). The wind load coefficients as a function of the wind direction for three different tower panels with a cylindrical microwave antenna are modeled as case studies. It is observed that the interaction between the tower and the microwave antenna has a significant impact on the wind load patterns. Large variations in the computed interference factors are found; interference factors larger than unity are observed in many cases (increasing the wind loads). It is also found that the drag forces computed by design standards are larger than those computed by the proposed simulation, calibrated with experimental results. A systematic overestimation of the loads may be appropriate for design purposes but not for resilience and risk analyses (when the accurate estimation rather than a conservative one is needed). The adopted procedure and the findings of this study can be of great importance for the telecommunication industry, which looks for reliable results with low computational efforts. In addition, it can enhance the risk and fragility analyses of telecommunication towers under strong winds.
Mohanad Khazaali, Liyang Ma, Keivan Rokneddin, Matteo Mazzotti, Paolo Bocchini.
Simplified Procedure for Estimating the Wind Load Coefficients of Telecommunication Towers and Microwave Antenna.
In Proceedings of the 2022 Conference of the Engineering Mechanics Institute, ASCE, p. 407, 2022.
Physics-Based and Data-Driven Portfolio Fragility Curves for Telecommunication Towers

In 2017, Hurricane Irma caused major damages to infrastructure systems, particularly telecommunication system. The strong winds led to the collapse of many telecommunication towers and interrupted communication services because several antennas were damaged. Similarly, Hurricane Michael in 2018 led to significant damages in the telecommunication sector. These are just examples of how vulnerable our telecommunication infrastructure is to relatively frequent events. This study focuses on predicting the loss of telecommunication functionality over a region caused by a hurricane. To do so, the study combines physics-based collapse fragility curves and data-driven service fragility curves for portfolios of telecommunication towers. Two regions affected by Hurricanes Irma and Michael were studied to calibrate and validate the models. The area around Miami (i.e., an urban region) was analyzed under Hurricane Irma, while the Florida Panhandle (i.e., a rural region) was examined under Hurricane Michael. Hurricane intensity measures (i.e., wind speeds) of the examined hurricanes and data for all towers were collected using available online sources for wind and cell towers. The recorded wind speeds were converted to 2 min sustained wind at 10 m height, the most common parameters for fragility curves. Next, the intensity measure was interpolated over the region of interest.
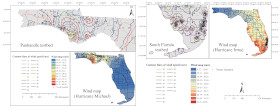
In order to estimate the percentage of collapsed towers in each county, fragility curves for different structural classes (i.e., water tank, monopole, guyed and lattice tower) were adopted from the literature and converted to be consistent with the selected intensity measure, while the service fragility curves were calibrated by minimizing discrepancy with the cell tower outage data provided by the Federal Communications Commission (FCC) for the studied events. In all analyses, the spatial correlation among the telecommunication towers was considered in the model. The findings of the study can be used to quantify the regional telecommunication system performance under strong wind events and help decision makers identify critical components and regions at highest risk of being disconnected. It may also be possible to extrapolate the results and apply them to other regions, to study and enhance the communication system resilience.
Mohanad Khazaali, Paolo Bocchini.
Physics-Based and Data-Driven Portfolio Fragility Curves for Telecommunication Towers Under Hurricanes.
In Proceedings of the 2022 Conference of the Engineering Mechanics Institute, ASCE, p. 408, 2022.
Random Field Calibration with Data on Irregular Grid for Regional Analyses

In engineering problems, it often occurs that geospatial data is available at an irregular grid of locations. When such data represents measurements of a random field, the calibration of its properties becomes challenging, because traditional techniques assume to have samples at regular frequencies in time and/or space. This study addresses the problem by proposing a simple, yet effective, technique and demonstrates it on a large-scale application of practical interest, covering the entire African continent. The example application deals with understanding the population dynamics of the main reservoir of zoonotic diseases, such as bats, which is a crucial step to predict and prevent potential spillover of deadly viruses like Ebola. In this case, the estimation of the population density is largely driven by the presence of the necessary resources for survival (food, nesting areas, appropriate climate), which is called “carrying capacity”. Due to the sparse data on wild animal density across Africa, this problem falls perfectly in the category described earlier. In this study, the carrying capacity of bats is studied, because they are considered the main reservoir for Ebola. The carrying capacity mean surface over the entire continent is calculated, and the fluctuations around the non-homogeneous mean are captured by a homogeneous random field. The statistics of this field are calibrated with the proposed methodology, despite the fact that the available data is unevenly spaced. In particular, the products of each pair of values in the entire dataset are used without any averaging for the estimation of the autocorrelation function, an analytical model is determined by a classical non-linear regression. This method does not require any interpolation or extrapolation of data and its use is efficient and simple. The correlation lengths along latitude and longitude are obtained as 1.78° (~200 km) and 1.40° (~150 km), respectively, and this can be interpreted in ecological terms as the correlation of resources affecting the survival of bats. Using the obtained characteristics of the random field, random realizations of the carrying capacity can be generated and fed into models of behavior and migration patterns of bats, to predict spillover of zoonotic diseases.
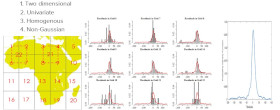
While the example application is in the field of bio-engineering, the proposed technique can be applied to many other topics in regional hazard analysis and catastrophe modeling, such as the calibration of hurricane wind speeds with unevenly spaced weather stations.
Sena Mursel, Daniel Conus, Wei-Min Huang, Javier Buceta, Paolo Bocchini.
Random Field Calibration with Data on Irregular Grid for Regional Analyses.
In Proceedings of the 2022 Conference of the Engineering Mechanics Institute, ASCE, p. 445, 2022.
Conditional Neural Network-Based Parameter Estimation for Non-Gaussian Wind
The simulation of non-Gaussian wind pressure fields on building envelopes is critical for the accurate evaluation of building vulnerability under wind hazards or coastal multi-hazards, where time-domain response analyses need to be conducted considering structural and aerodynamic nonlinearities. Existing simulation methods typically rely on specific wind tunnel test data. Specifically, for each target building, the parameters of the pressure field models [e.g., probability distribution function (PDF), power spectral density (PSD), and coherence] need to be obtained from specific wind tunnel tests. However, in practice, significant variation in building geometries, design details, and wind hazard exposure may exist, thus posing a challenge to extrapolate the case-specific derived pressure field models to support regional risk and resilience quantification. To address this issue, a conditional neural network-based parameter estimation is proposed in this study to estimate model parameters based on existing wind tunnel test data.
In the proposed framework for wind pressure field generation, the conditional neural network is composed of two parts: (1) the weight-generation sub-network (WGSN) and (2) the parameter-estimation sub-network (PESN). The conditional neural network essentially leverages a two stage model to interpolate existing test data for a certain building and across different buildings. Specifically, the WGSN takes the condition vector (e.g., building geometry, wind direction, and terrain roughness) as input and provides as output the weights for the PESN. The PESN takes the coordinates of sensors across a given building configuration as input and provide as output the model parameter vector. In this way, the complex relationship between the wind pressure and wind condition vector is captured, allowing efficient estimation of the non-Gaussian and non-homogeneous pressure field for subsequent probabilistic response analyses. In this study, the University of Western Ontario Boundary Layer Wind Tunnel dataset is used for training and validating the proposed conditional natural network, which is implemented with PyTorch. A novel four-parameter coherence model is proposed to describe the wind pressure field together with existing parametric PDF and PSD models. The trained network shows good performance in estimating the model parameters for wind conditions in the validation data. The resulting model can pave a path toward fragility modeling of a diverse set of buildings exposed to wind and coastal multi-hazards, supporting risk and resilience assessment in such coastal settings.
Haifeng Wang, Paolo Bocchini, Jamie Padgett.
Conditional Neural Network-Based Parameter Estimation for Non-Gaussian Wind.
In Proceedings of the 2022 Conference of the Engineering Mechanics Institute, ASCE, p. 553, 2022.
Structural Topology Optimization Using an Enhanced and Robust Genetic Algorithm

Topology optimization is gaining popularity in recent years due to increased interest in minimizing material waste and the growing availability of large scale 3D printing. Genetic algorithms (GA) provide an effective means of achieving optimization. GAs possess high flexibility on the expression of objective and constraints and have been seldomly applied to topology optimization. GAs mimic the biological concept of survival of the fittest, by analyzing generations of individuals (i.e., sets of trial solutions) and their ability to minimize the objective(s). The most successful individuals are recombined to form the next generation, through operations called “crossover” and “mutation”, which involve an element of randomness. In topology optimization, the random crossover and mutation tend to generate a large number of redundant individuals, slow down the convergence, and result in unstable (i.e., not robust) output.
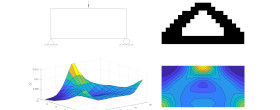
To address these issues, an improved GA, specifically tailored to topology optimization through the use of a strong shape constraint and enriched information obtained from inline finite element analyses is proposed in this study. The strong shape constraint adds a filter to all the individuals at the beginning of each iteration in order to prevent redundant calculations. The utilization of the enriched information serves as specific guidance to the mutation and reproduction process, which results in a high convergence rate to the optimal shape. Three case studies are considered to investigate the performance of the proposed algorithm compared to conventional GA and the SIMP (solid isotropic material with penalization) method, which is the most widely used topology optimization algorithm in both academia and industry. The first study investigates the robustness of the optimization process. With the utilization of the proposed algorithm, high robustness is achieved and the probability of convergence to impractical shapes is reduced to almost zero. The second study indicates that the proposed algorithm expedites convergence and reduces the computational cost to one half. The third case study showcases the performance and superiority of the proposed algorithm in reaching optimized shapes which can be manufactured in the industry.
Xingjian Wang, Clay Naito, John Fox, Paolo Bocchini.
Structural Topology Optimization Using an Enhanced and Robust Genetic Algorithm.
In Proceedings of the 2022 Conference of the Engineering Mechanics Institute, ASCE, p. 687, 2022.
Predicting Wildfire Ignition Induced by Conductor-Vegetation Contact Under High Winds

Under fire weather conditions that feature high winds, electric power systems have been shown to be a rising source of catastrophic wildfires. The utility-related wildfires are mostly attributed to conductor-vegetation contact which can then lead to flashover (or sparkover) and subsequent ignition. Decision making, such as proactive power shutoffs and vegetation management, can be informed by wildfire risk analysis, in which the ignition probability analysis is a key component. This study focuses on the ignitions caused by the conductor swinging out to nearby vegetation under high winds. The problem is formulated in the context of proactive de-energization with a focus on the transmission system. Specifically, the failure (or limit state) is defined as the conductor encroaching into the prescribed minimum vegetation clearance and is examined through quantifiable distances. The stochastic properties of the dynamic displacement response of transmission conductors are derived from spectral analysis in the frequency domain.
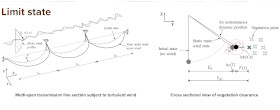
The probability of encroachment, proposed as the proxy for the probability of ignition, is estimated by solving a classical first-excursion problem based on random vibration theory. The impact of conductor dynamics on encroachment probability is investigated considering varied wind intensities and vegetation clearances. A numerical example featuring a two-span transmission line is given, and an example application at the transmission system level is presented. It is found that the conductor exhibits appreciable variations in its displacement response under turbulent high winds. Neglecting this uncertainty can underestimate the wildfire risk from power systems. In addition to the durations of wind events, the results show the importance of vegetation clearance and wind intensity, by quantifying their effects on the encroachment probability. These findings provide evidence of the value of high-resolution data on these quantities. While flexible in accommodating various combinations of wind loading, structures and vegetation, the presented methodology provides a potential avenue for accurate and efficient ignition probability prediction.
Xinyue Wang, Paolo Bocchini.
Predicting Wildfire Ignition Induced by Conductor-Vegetation Contact Under High Winds.
In Proceedings of the 2022 Conference of the Engineering Mechanics Institute, ASCE, p. 688, 2022.
Useful links
- Proceedings of the 2022 EMI Conference: www.emi-conference.org/sites/emi-conference.org/2022/files/inline-files/EMI%202022%20Book%20of%20Abstracts.pdf
- EMI Conference: www.emi-conference.org
- Engineering Mechanics Institute: www.asce.org/communities/institutes-and-technical-groups/engineering-mechanics-institute
- American Society of Civil Engineers: www.asce.org