Oscillatory dynamics of Cdc42 GTPase in the control of polarized growth
Das*, M., T. Drake*, D.
Wiley, P. Buchwald, D. Vavylonis, and F. Verde,
Science, 2012 (*:co-first-authors).
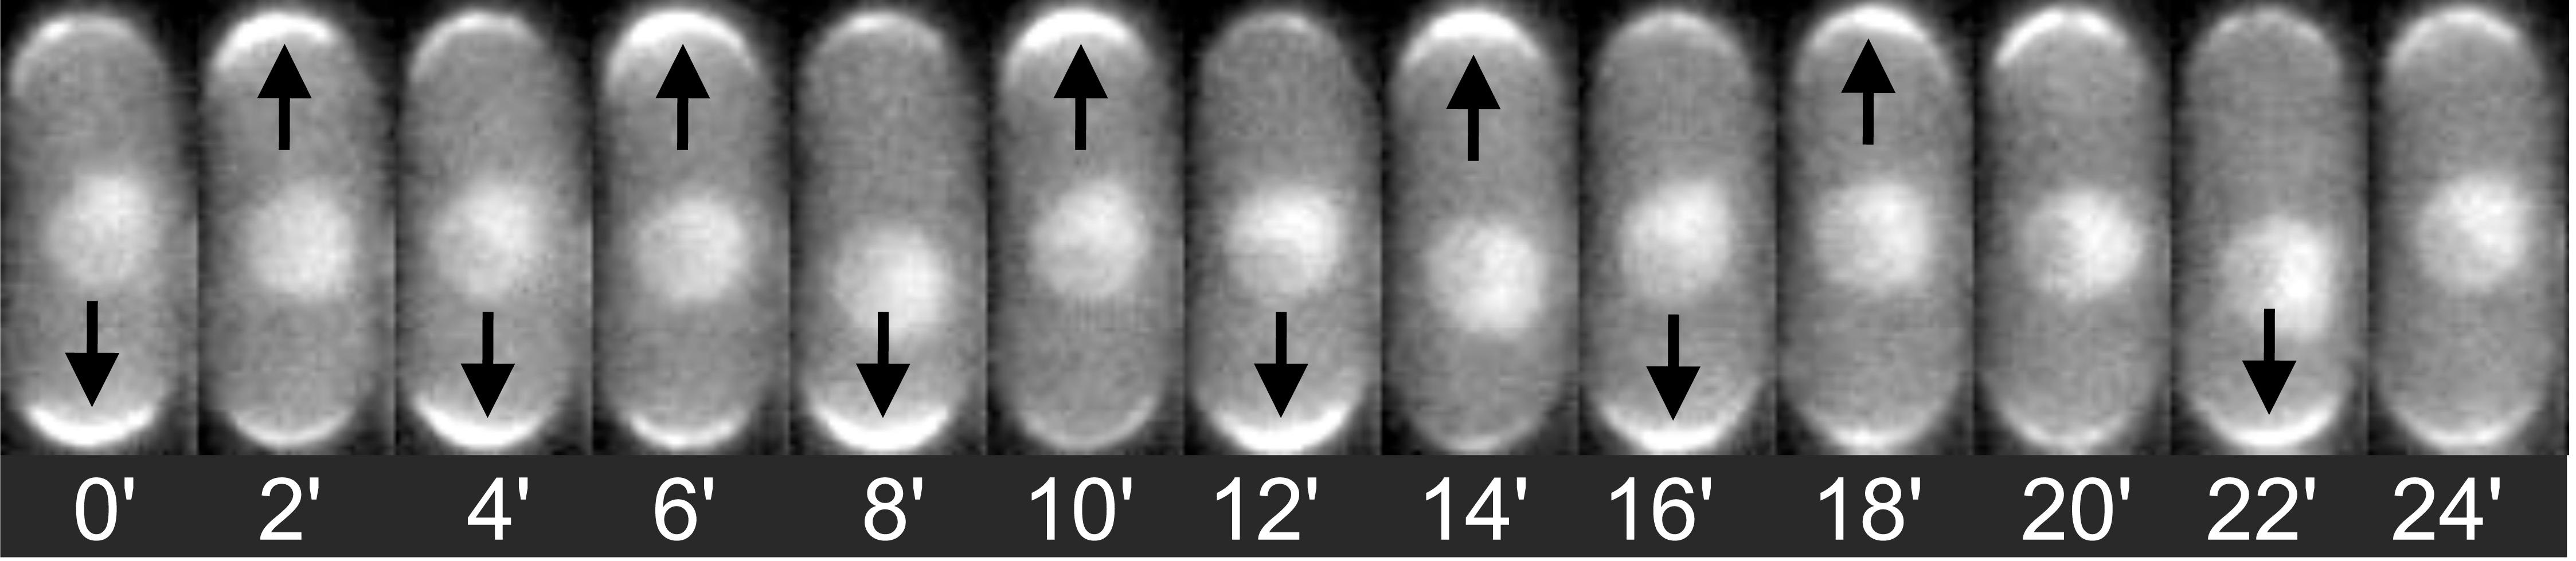
Time-lapse of fission yeast expressing CRIB-GFP (a fluorescent marker for active Cdc42) showing oscillations of tip intensity.
1. Mathematical model for Cdc42
oscillations in fission yeast
![]() Association to the tips obeys:
Association to the tips obeys:
![]()
where , j = 1, 2. Autocatalytic activation,
![]() ,
,
with n ≥ 2, generates asymmetry by allowing one tip to deplete the cytoplasmic pool and preventing the other tip from gathering Cdc42. Saturation at level Csat allows long cells to be bipolar. Oscillations result by assuming Cdc42 triggers its own removal (delayed negative feedback):
![]() .
.
Here,
![]() determines the delayed
dissociation strength,
determines the delayed
dissociation strength,
![]() is delay time, and the
Hill coefficient
h
gives the nonlinearity of the effect.
is delay time, and the
Hill coefficient
h
gives the nonlinearity of the effect.
2. Numerical integration
Cdc42ODEPapp (executable jar file, source code, documentation): This program integrates the above dynamical equations, allowing for the change of parameters. It uses the Open Source Physics libraries. To run, double-click the jar file, change the parameter values or use the default values, press 'Initialize,' and then press 'Start.' The vertical positions of the blue and black dots give the portion of Cdc42 bound to the two tips and the horizontal axis gives time in minutes.
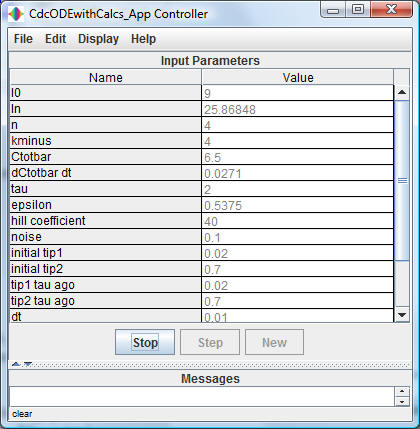
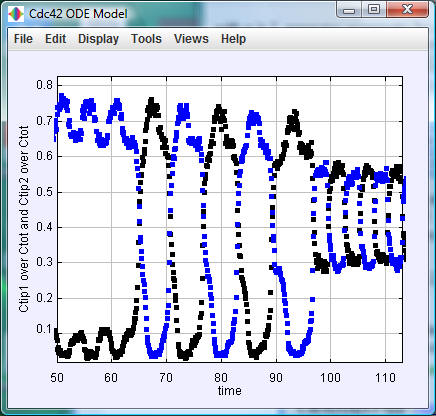
The default values of the
model parameters are those in Table S4 of the
paper; the default value of the noise parameter
gamma is zero.
3. Image Analysis
The following ImageJ plugins were used to measure tip intensities and growth rates.
MouseX: an ImageJ plug-in to crop and rotate individual cells. Developed by Matt Smith.
BGSubtract (class file, source code): an ImageJ plug-in to subtract the cell background. To use, select an area of the background and activate the plug-in. It subtracts the mean intensity of the area from the entire image and blacks out anything within three standard deviations of the intensity in the selected area.
Kymograph Point Tracker (class file, source code, instructions). An ImageJ plug-in to track a feature in a kymograph where time is the vertical axis. Tracking starts by two successive left-clicks to define a region for tracking (blue points). The plugin tracks intensity maxima, minima, or highest intensity derivative, depending on the placement of the blue points on the image.
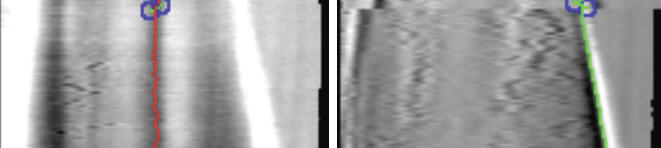
Sample usage of Kymograph Point Tracker to track scar (intensity minimum) and tip position (highest intensity derivative) of a fission yeast cell. The plugin is applied to kymographs (right) constructed from box regions of a time lapse series (left). The growth rate can be calculated by measuring the distance between scar and tip positions over time.
The compiled versions of the above plugins (class files) should be placed in the ImageJ plugins directory.