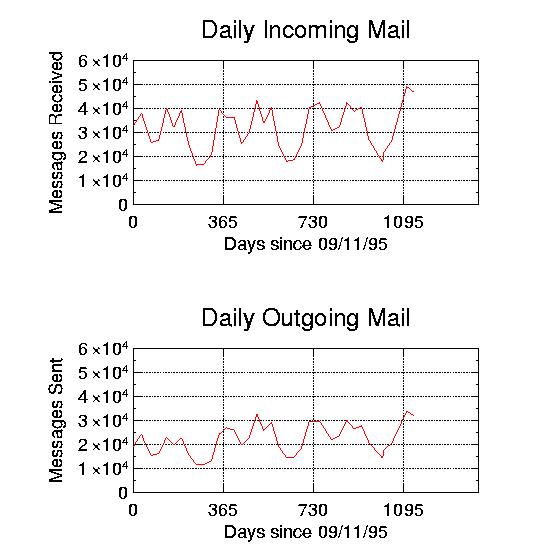
What we have are 3 academic years (95-96, 96-97, & 97-98), with peaks during the semesters, and valleys during the summer and breaks.
Until recently, it appears that the incoming mail volume has risen only slightly for 3 years, and the outgoing shows a distinct increase between 95-96 and 96-97, and comparable volume during 97-98.
While it is too early to accurately predict the 98-99 usage, it is interesting
to note that in both graphs the final data points are at record high levels.