The Problem
Step 1: Computing the Component
Costs
Step 2: Computing the Break Points
Step 3: Computing the Weighted Marginal Cost
of Capital
Step 4: Comparing IRR vs.
MCC
Step 5: Computing the Weighted Average Cost
of Capital
Step 6: Computing the NPV of Project B
On January 1, 1997 Bunky's Burgers, Inc. is planning its yearly capital budget and is faced with a list of 5 potential independent proposals:
|
|
|
|
|
|
|
|
|
|
|
|
|
|
|
|
|
|
|
|
|
|
|
|
| Debt | $120,000,000 | |
| Preferred Stock | 20,000,000 | |
| Common Equity | 60,000,000 | |
| TOTAL CLAIMS | $200,000,000 | |
Bunky's can raise new funds under the following conditions:
BONDS: (Up to $24,000,000) New 20 year $1000 par value bonds carrying a coupon of 12 per cent (payable annually) are priced to yield the investor 10% a year. Flotation costs total $70.27 per bond.
(Beyond $24,000,000) A second issue of 20 year 12 per cent coupon bonds can be sold to yield the investor 14% a year. Flotation costs total $67.54.
PREFERRED STOCK: Any size issue of new preferred stock can be sold to yield the investor 16%. Underwriters charge a fee of 20% of the selling price.
COMMON STOCK: Issuing up to $7,500,000 of new common stock requires underpricing and flotation costs equal to 20% of the stock's price. Beyond $7,500,000 requires flotation costs equal to 30% of the selling price.
{a} Which projects should Bunky's accept? Your analysis must include the calculation of the marginal cost of capital along all of the various segments. CLEARLY display your MCC and IRR results on a CAREFULLY labeled LARGE graph. (Carry all calculations to four decimal places; e.g., .1234 or 12.34%).
{b} What is the weighted average cost of capital for the capital budget you are advocating in part {a}?
{c} Compute the NPV of project B. Assume uniform cash flows and a life of 6 years.
{d} If Bunky's cost of equity is so much more than its cost of debt, how can it think raising nearly half of its funds from equity is "optimal"?
The first step in a cost of capital problem is to find the costs of the individual components. Let's start with new debt or bonds. The firm can raise up to $24,000,000 by selling new bonds with the following characteristics: maturity of 20 years (and since the coupon is paid annually, we keep n as 20 years rather than our usual doubling to 40 semi-annual periods--don't do that if interest is paid annually); coupon of 12% or $120 per year (again, do not halve this since it's on an annual basis for simplicity); par value = $1,000; and the investor makes 10% a year. We need to know what the investor paid for a bond in order to produce a yield of 10%. That's easy: P0 = 120(PVIFa-10%-20) + 1000/(1.10)20 = 1,170.27. The problem also states that selling new bonds requires flotation costs of $70.27 per bond. If the investor paid 1,170.27 and the investment banker or underwriter takes 70.27, that leaves the firm with an even $1,100. Now let's solve for the before-tax cost of the bonds. The formula is very similar to finding the yield to maturity on a bond except that the cash flows are set equal to the net proceeds from the sale rather than the price. So, it's 1100 = 120(PVIFa- k-20) + 1000/(1+k)20. Solve for k=10.76%. Since the interest payments are tax-deductible and the firm has a marginal tax rate of 35%, the after-tax cost to the firm of the new debt ki=.1076(1 - .35) = 7.00%.
If the firm needs to sell more than $24,000,000 of new bonds, the cost of the incremental bonds is gotten the same way. The yield to the investor is 14% a year and flotation costs are 67.54. This information should produce a P0 = 867.54, net proceeds, I0 of 800, a before-tax cost of 15.24% and an after-tax cost of .1524*(1 - .35) = 9.90%. Verify that these figures are correct.
So, the cost of selling the first $24 million of new bonds is ki1=7.00%. Any additional bonds would cost ki2=9.90%.
Now let's solve for the cost of selling any new preferred stock, kp. Any size issue can be sold to yield the investor 16% and flotation costs are 20% of the selling price. Now we know that preferred stock pays a constant dividend in perpetuity and we know from class that the yield on preferred is D/P0. Uh oh, we don't know D and we don't know P0. Do we panic? No! The investor's return or yield is 16%. So, we know that .16 = D/P0 and kp = D/I0. We also know that I0=P0 - flotation costs. If flotation costs = .20*P0, then I0=P0 - .20P0 = .8P0. Substituting, we know kp = D/.8P0 or (D/P0)/.8 or .16/.8 = .20. The cost of issuing any new preferred stock, kp, is 20%.
The cost of retaining earnings is an opportunity cost equal to the rate of return the market could make by taking the dividends of this firm and using them to buy stock in another firm of similar risk. The opportunity cost of IBM retaining earnings rather than distributing them as dividends is equal to the return the IBM investors could make by investing their IBM dividends in the common stock of ATT or GE. If we assume a normal growth model for the firm in the problem, then their required return is ke = D1 /P0 + g. We know from the problem that the dividend yield (D1/P0) is 18%. We need to just find the dividend growth rate.
4 years ago the dividend was 5.545 and yesterday it was 7.00. That means the dividend has been growing at a rate of 6.00%. 7.00 = 5.545(1 + g)4 and then solve for g. Because we'll need it in a minute for the cost of new common stock, let's extrapolate the growth in dividends for one more year. We get D1 = 7.00*(1.06) = 7.42. Back to the cost of retained earnings, ke. It's the sum of the dividend yield (.18) and the growth rate (.06) or .24.
Now we need the cost of issuing new common stock. We know kn=D1/I0 + g. We just need to find I0, the net proceeds from issuing a new share after subtracting out flotation costs and any underpricing necessary to sell the shares. If the dividend yield is .18 and D1 is 7.42, we know that P0 is 7.42/.18 or $41.22. If the firm sells up to $7.5 million of new common stock, there is underpricing and flotation costs equal to 20% of the current price or .20(41.22) = 8.24. This leaves I0 of 41.22 - 8.24 = 32.98. Substituting this for I0 gives the cost of new common stock as kn1 = 7.42/32.98 + .06 = 28.50%. If the company sells more than $7.5 million of new common stock, the flotation costs rise to 30% of the current price and the net proceeds fall to 41.22 - .3(41.22) or 28.85. This makes the cost of the marginal shares beyond $7.5 million kn2 = 7.42/28.85 + .06 = 31.72%.
We're done with the first step. Let's recap: ki1 = .070; ki2 = .0990; kp = .2000; ke = .2400; kn1 = .2850; and kn2 = .3172.
Now that we have all the component costs, we need to know where the "break points" occur. There are two costs of debt: the firm can sell up to $24 million of new bonds at a cost of 7.00% and any additional bonds beyond $24 million at 9.90%. To find where a break in the marginal cost of capital schedule occurs, we just need to know two pieces of information: the weight of debt and the maximum amount of bonds that can be sold at 7.00%. Historically, the firm has raised $120 million out of a total of $200 million in all funding from debt. If this continues and the problem explicitly states that the firm's capital structure is "optimal and will be maintained", we can assume that 120/200 or 60% of all future funding will come from new debt. If 60% of the funds will be debt and the firm can raise up to $24 million at 7.00%, then how much total funds from all sources can be raised without having to issue the more expensive 9.90% bonds? .60 of X has got to be less than or equal to $24,000,000. So, if .60X <= 24,000,000, then X = $40 million. If the firm ties to raise $41 million, they will need .60 x 41 = 24.60 million from debt. Well, that means the first pot of debt is used up and 600,000 has to come from the more expensive, 9.90% pot. So, $41 million is too much. The break is at $40 million.
For preferred stock, there is no break because any size issue costs the same, 20%. Freebie!
For common equity, there will be two breaks: when the $4.5 million retained earnings is used up and the $7.5 million pot of common stock has to be tapped and when this cheaper common stock is used up and the more expensive common must be tapped. Historically, 30% (60,000,000/200,000,000) of the firm's funding has come from equity. Applying the same logic as we used in the debt section above, this means that .30Y<=4,500,000 where Y is the amount of all funds that can be raised without exhausting the $4.5 million in retained earnings. Y = 4.5/.3 = $15,000,000.
To use up the $7.5 million available from the cheaper new common stock, the firm must actually go through first the $4.5 million of retained earnings. This means that a total of 4.5 + 7.5 = 12 million of equity can be raised without having to sell any of the most expensive source of equity, the 31.72% new common stock. Therefore, .30Z<=(4.5+7.5) where Z is the second break point due to equity. Z = $40 million.
Let's recap the breaks: Debt at 40 million (ki1 to ki2); preferred stock has no break (kp doesn't change); common equity at 15 million (ke to kn1) and 40 million (kn1 to kn2).
We're now ready to put everything together and find the firm's marginal cost of capital.
Step 3: Weighted Marginal Cost of Capital
| 0 - 15 | 15 - 40 | 40 + | ||
| Source | WT. | MCC1 | MCC2 | MCC3 |
| Debt | .60 | 7.00 | 7.00 | 9.90 |
| Pf'D | .10 | 20.00 | 20.00 | 20.00 |
| Equity | .30 | 24.00 | 28.50 | 31.72 |
| 13.40 | 14.75 | 17.46 |
Step 4: IRR vs. MCC
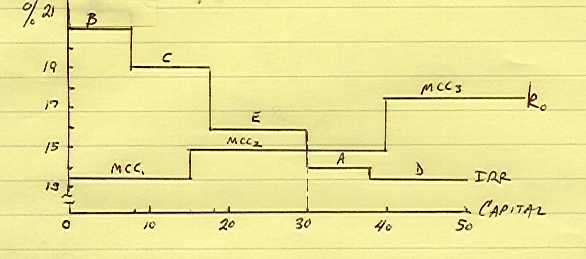
First step is to arrange the projects from most desriable to least
desirable. List them in descending order as ranked by IRR. B is the best
at 21.0%. C is next at 19.0%. All the way through D, the worst at 13.5%.
On a graph with total capital (in $ millions) on the x-axis and cost (in
percent) on the y-axis, plot the IRR schedule. For each project, plot IRR
vs a cumulative outlay. For B it's just the outlay of $8 million. For C
it's $18 million (8 for B and 10 for C). For E it's $30 million (B+C's
18 + E's 12). Got it? Take a look at my crude graph.
On the same graph, plot the three sections of the marginal cost of capital schedule: 0 - 15 is 13.40%, 15 - 40 is 14.75% and 40 + is 17.46%. The two schedules intersect at $30 million. Projects B, C and E are acceptable. Projects A and D fail to clear the MCC hurdle and should be rejected. The firm will want to raise $30 million to finance the three projects. How much will the $30 million cost?
Step 5: Computing the Average Cost of
Capital
This is a snap. To find the cost of raising $30 million, we just need
to see where it comes from. The first $15 million comes from sources up
to the first break point. Therefore it costs 13.40%. The second $15 million
comes from the middle segment of the MCC schedule and, therefore, costs
14.75%. Just take a weighted-average of these two costs. (15/30) x 13.40
+ (15/30) x 14.75 = 14.08%. The average cost of raising $30 million is
14.08%.
Step 6: Computing the NPV of Proposal
B
To find the NPV of B we need to first know it's expected cash flows.
We know the outlay is $8,000,000, the life is 6 years, and the IRR is 21%.
That means 8,000,000 = DCF(PVIFa
- .21 - 6). Solve for DCF = $2,465,624 per year.
To compute the NPV, we just need the required rate of return. This will
be the MCC according to our graph. Project B should be thought of as being
financed with the first $8 million raised by the firm and this is at a
cost of 13.40%. Therefore, the NPV is equal to - 8,000,000 + 2,465,624(PVIFa
- .134 - 6) = $1,747,636.