How to plot in SAS?
We oftentimes need to generate plots in SAS. And we won't talk about complicated plots, just basic ones. For those who want to learn more, check manual about SAS/GRAPH. Here, I only talk about scatter plot and several options used in "PROC REG;".
1. "PROC GPLOT;" procedure
(i). Syntax:
----optionalGOPTION <options>;
PATTERNn <options>;
----optionalSYMBOLn <options>;
----optionalAXISn <options>;
----optionalPROC GPLOT DATA=... <options>;
PLOT (y-vars)*x-var/<options>;
PLOT2 (y-vars)*x-var/<options>;
----optionalRUN;
QUIT;
(ii) Description:
This procedure is meant to generate scatter plot. "PLOT" statement allows you to specify x and y variables. You can use (Y1 Y2 Y3)*(X1 X2) to signify 3*2=6 plots. "PLOT2" statement provides way to generate called YY-X plots. That means you want to overlap two plots with same x variable but different y variables. "GOPTION" is used to specify the global graphing options. "PATTERN", "SYMBOL", and "AXIS" are used to customize your plot. The letter n is an positive integer. You can have several specifications of symbol especially you have many curves overlapped in one graph.
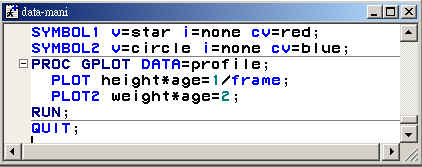
(iii) Example:
Here I use the data set generated in the previous step to demo the "PROC PLOT;" procedure. I first define two symbols for later use. Then in the main procedure, I plot both height and weight against age, overlap the two plots together. The "= 1" part in plot statement means using symbol definition 1. While the option "frame" just telSl AS to frame the plot. You may try to take that out, try to see what happen. There is other thing you might try: using (height weight)*age to see the difference.
2. Options in "PROC REG;" procedure:
2, AIC, BIC, ...etc.).In REG procedure, you can invoke PLOT statement to generate several plots.
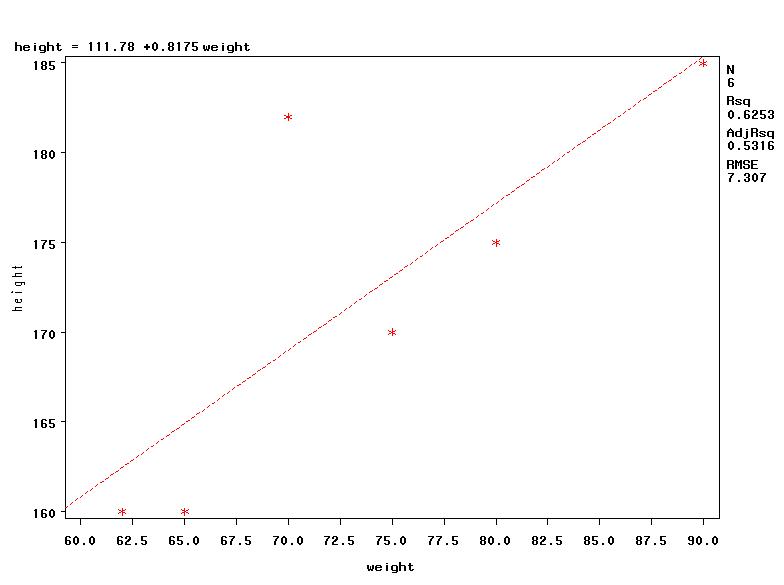
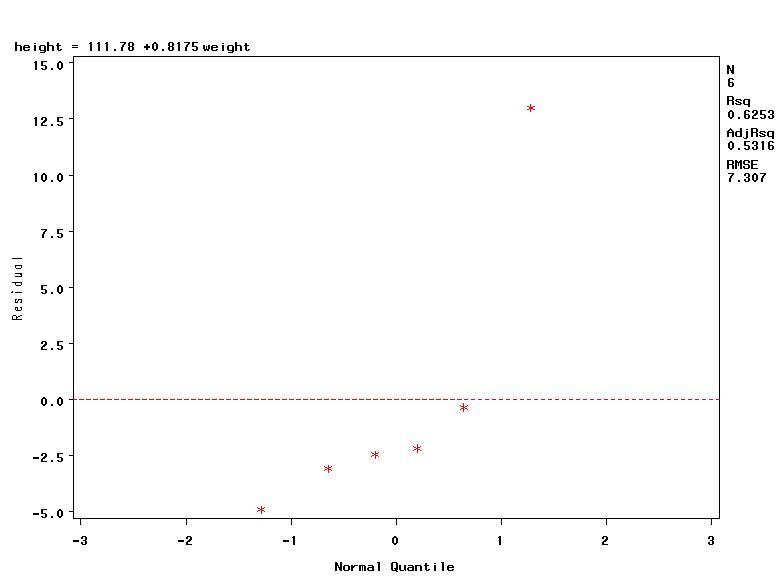
(i). Scatter plot with regression line and other model related statistics (R
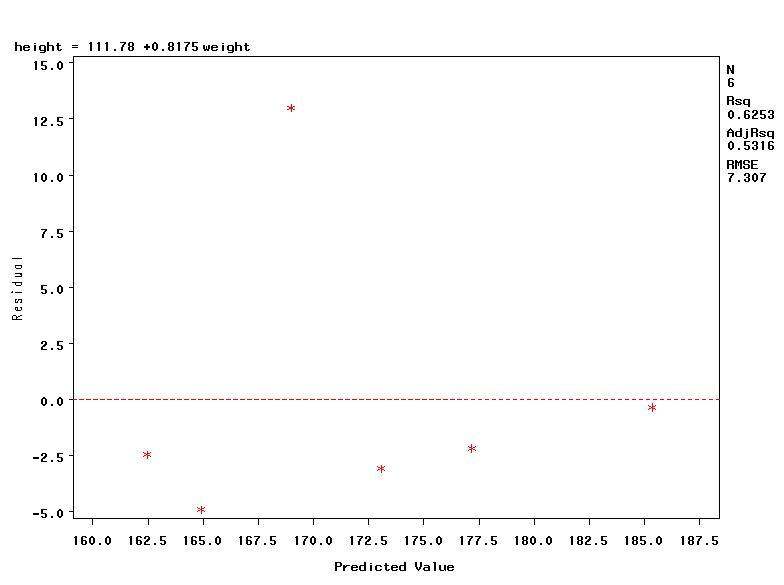
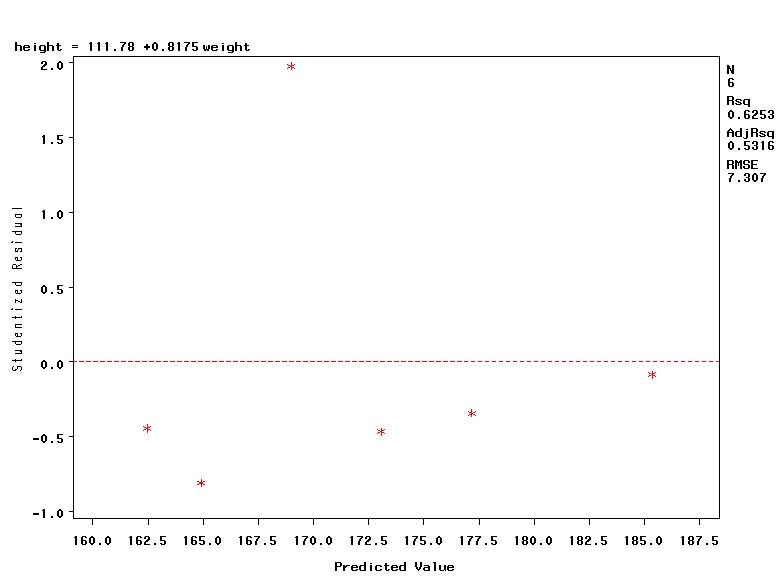
(ii). Residual plot (or Studentized residual plot) ----> checking i.i.d. assumption.
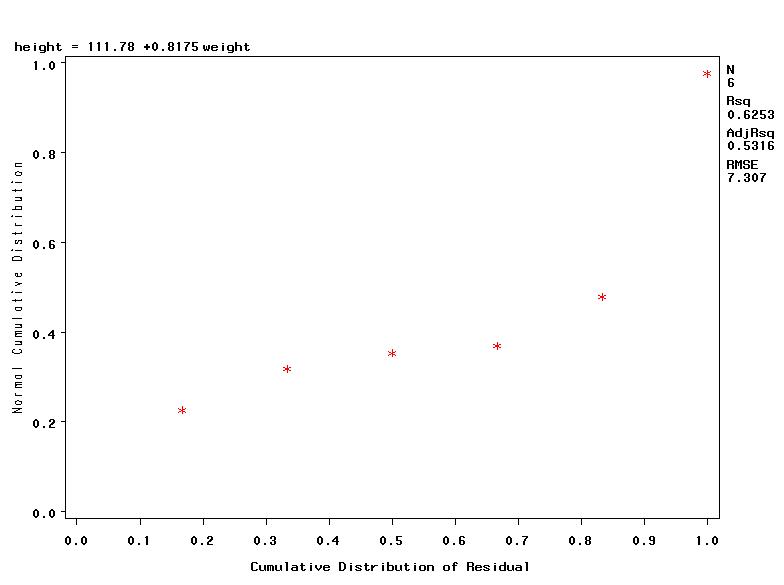
(iii). QQ-plot, Normal PP-plot for residual ----> checking normality assumption.
Example:
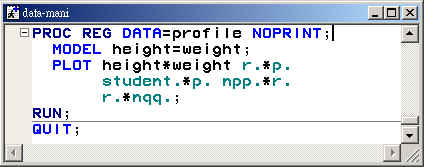
And you will see plots