MSA
MSA>MSA>Weighted PCA
Current Function Version: 1.0 (Oct./30/'08)
Brief Description
This function performs principal component analysis (PCA) to a 2D or 3D spectrum image (SI) with proper weighting based on Poisson statistics. Since this function creates many result files from a single SI file, it would be better to create a dedicated folder before you apply this function. After decomposing the SI file, you can extract each component: a pair of a loading spectrum (spectral feature) and a score image (spatial amplitude). Then, you can reconstruct a noise-free (or noise-reduced) dataset from the original SI. In addition, you can also check the PCA application from a residual data (difference between the original and reconstructed SIs).
Usage
As mentioned above, you should create a dedicated folder before you apply PCA to your SI. This technique requires a lot of memory. So, it is strongly recommended to close all files in DigitalMicrograph. This function tries to use only available physical memory. Even if the available physical memory is limited or smaller than the targeting SI, you can still complete PCA as long as the SI can be opened in DigitalMicrograph. However, if the available physical memory is smaller, it would take much longer for processing.
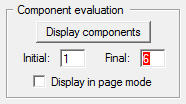
After closing all the opened files, select MSA>MSA>Weighted PCA from the menu bar. Then, the following dialog appears.
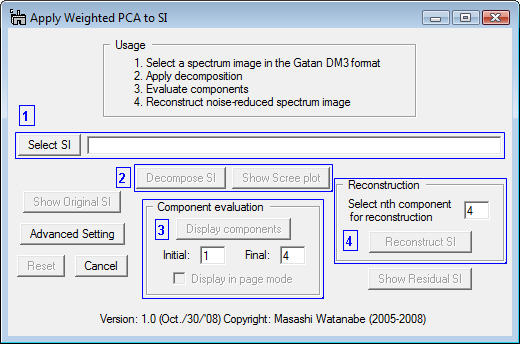
The numbers in the red and blue boxes indicate the step you should follow in order to apply PCA. Namely,
- Select a 2D or 3D spectrum image in the Gatan DM3 format
- Apply matrix decomposition to the SI
- Evaluate componenets
- Reconstruct the noise-reduced spectrum image
- First, click the Select SI button in the region 1 of the dialog, then the dialog for file open appears.
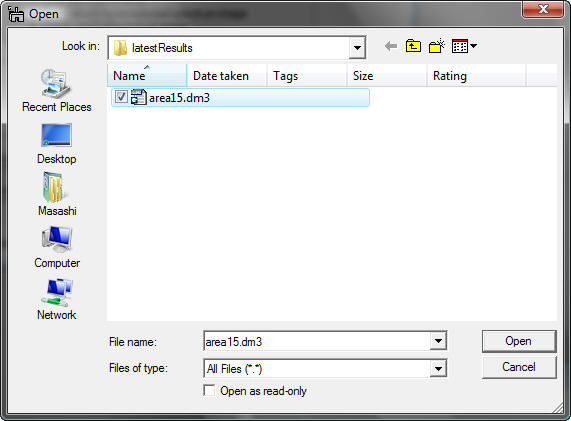
You can select the desired SI file and click the Open button. The selected file name appears in the string filed with the absolute path.

- Once the data is selected, the Decompose SI button is activated in the region 2.
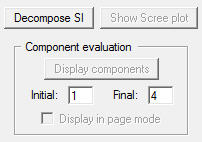
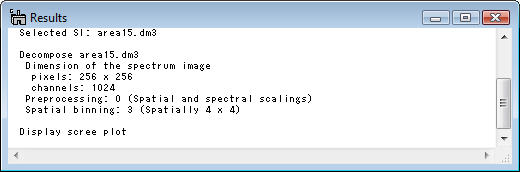
Then, click the Decompose SI button. This process would take a few seconds to a few minutes depending on your CPU speed and the data size. As long as the progress window displays the following message, your PC is NOT frozen.
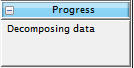
Just wait until the scree plot is displayed.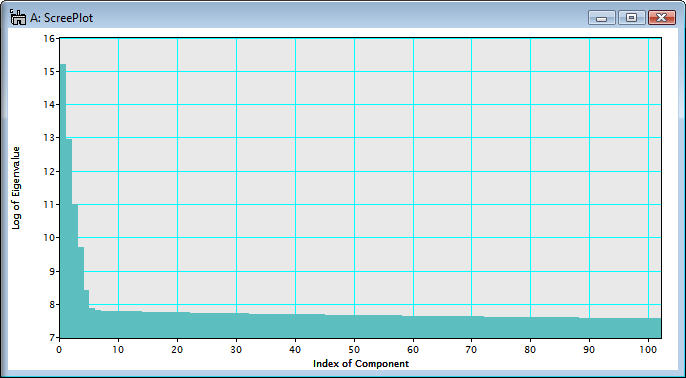
Note that the scree plot is logarithm of the eigenvalues graphically plotted against the index of component. A number of principal components is usually evaluated based on the scree plot. In the above example, a number of the principal components distinguished from the noise components can be 6 or 7 from the primary principle component.
- After the data is decomposed, the Display components button is activated in the region 3.
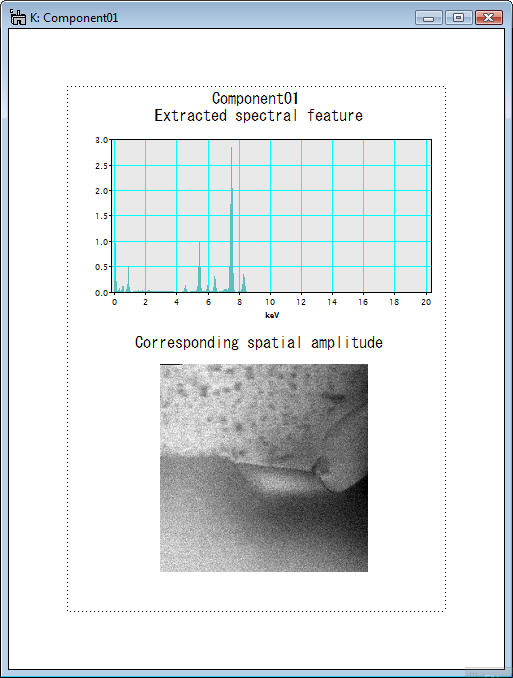
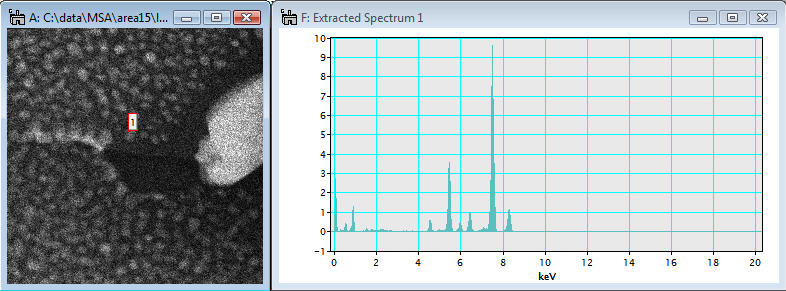
It would be very helpful to evaluate each component in terms of a pair of a loading spectrum (spectral feature) and a score image (spatial amplitude) in order to distinguish the principal components from noise. To view components, input the component range you want to evaluate in the Initial and Final boxes and click the Display components button. Then, selected components are displayed (note: in this example, the components are rearranged to show all).
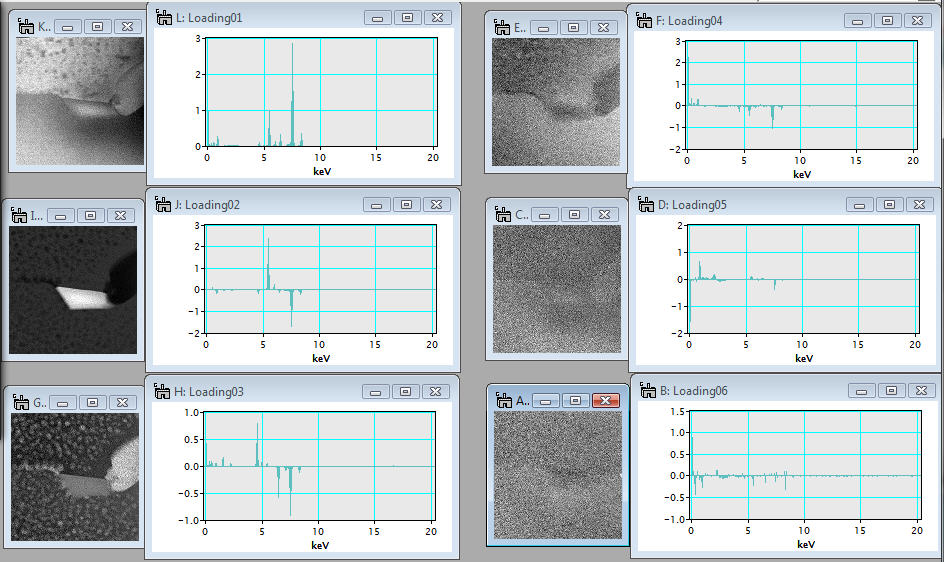
In the above example, the spectral feature and spatial amplitude of each component are displayed individually. Conversely, the spectral feature and spatial amplitude can be displayed together in the page mode if the check box Display in page mode is checkedin the region 3.
It is very important to evaluate individual components and to distinguish statistically significant ones from noise. The function of displaying components is one of main features of this plugin.
- After the data is decomposed, the Reconstruct SI button is also activated in the region 4.
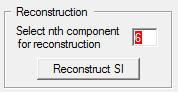
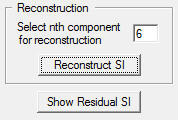
By evaluating of individual components, principal components can be distinguished from noise components and it is possible to reconstruct the spectrum image data with reduced noise. Input the last index of principal component in the box and click the Reconstruct SI button. Then, data reconstruction process starts. This process could take longer depending on the using PC and data size. However, if the following message appears in the progress window, the process is progressing.
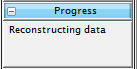
After the reconstruction process is completed, the reconstructed spectrum image is displayed.
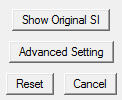
Now, the Show Residual SI button is finally activated in the region 5.
The residual SI is the difference between the original and reconstructed SIs. Therefore, the validity of reconstruction can be confirmed by comparing the residual SI with the original and reconstructed SIs.
Note that you can reset the paramters in this dialog by clicking the Reset button
The summary of each step descrived above can be seen in the Result window.
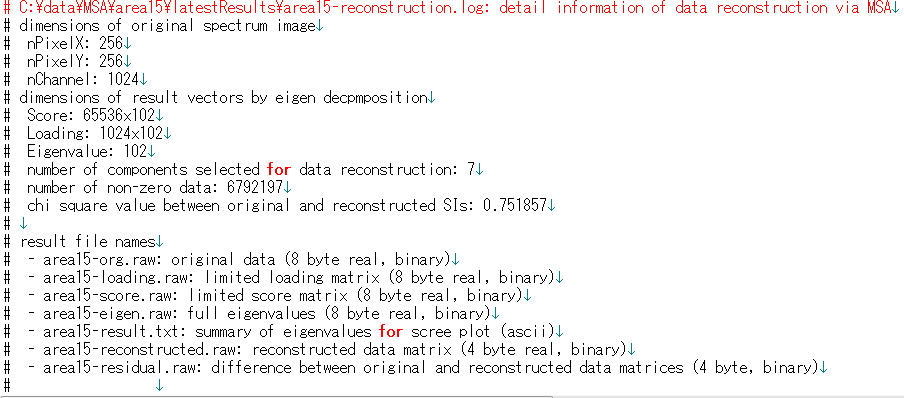
Output files
Many output files are generated from a single spectrum image by this PCA plugin. Here is the summary:
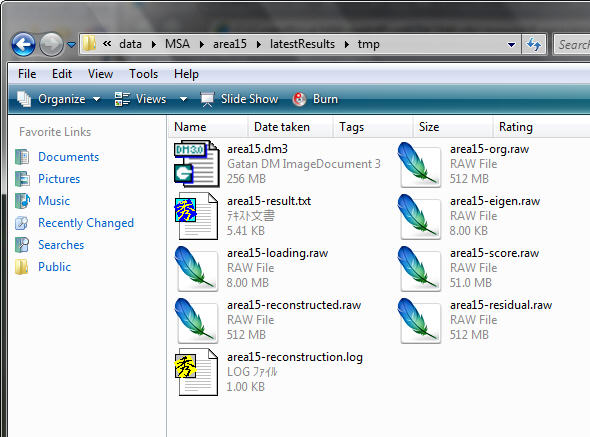
If a spectrum image file in the dm3 format named foo.dm3 is processed, following files are generated:
- foo-org.raw: original data converted from the original dm3 file (8 byte real, binary)
- foo-result.txt: summary of eigenvalues for scree plot (ascii)
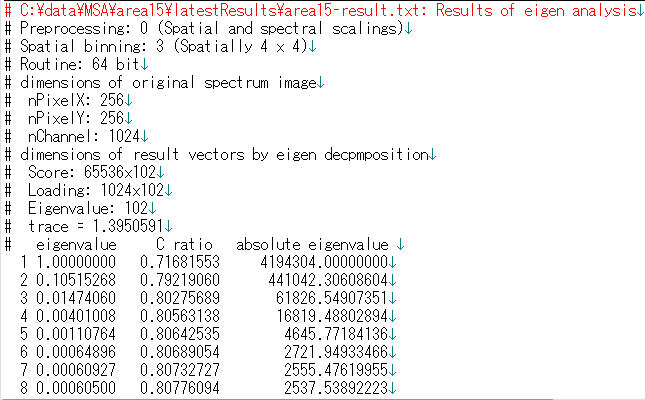
- foo-eigen.raw: full eigenvalues (8 byte real, binary)
- foo-loading.raw: limited loading matrix (8 byte real, binary)
- foo-score.raw: limited score matrix (8 byte real, binary)
- foo-reconstructed.raw: reconstructed data matrix (4 byte real, binary)
- foo-residual.raw: area15-residual.raw: difference between original and reconstructed data matrices (4 byte, binary)
- foo-reconstruction.log: summary of reconstruction (ascii)
Advanced Setting
Several parameters for preprocessing/processing can be choosed in this plugin. If you prefer to change those settings, click Advanced Setting button.
Then, a sub dialog appears.
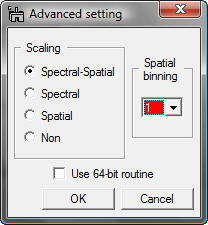
Caution: If you do not have any idea, DO NOT CHANGE THESE PARAMETERS (KEEP THE DEFAULT SETTING)!
Scaling: selection of scaling is extremely important for proper PCA applications. The detail can be seen in literature (R.N. Cochran & F.H. Home, "Statistically weighted principal component analysis of rapid scanning wavelength kinetics experiments", Anal. Chem., 49 (1977) 846-853; M.R. Keenan, P.G. Kotula, "Accounting for Poisson noise in the multivariate analysis of ToF-SIMS spectrum images", Surf. Interface Anal., 36 (2004) 203-212).
Binning: you can apply spatial binning to enhance your spectral features from a spectrum image with many pixels. If the spectrum image has many pixels, you may apply spatial binning of 2 or 4. However, this preprocess does not degrade spatial resolution in the final decomposed data.
Use 64-bit routine: if you use DigitalMicrograph under 64-bit Windows (XP x64, 64 bit Vista and maybe 64-bit Windows Servers), this check box is automatically activated. If this option is checked, this plugin calls an independent 64-bit command-line routine via system call. Since DigitalMicrograph is currently 32-bit program, it is impossible to integrate such 64-bit routine under any 32-bit program. However, the major limit of the 32-bit program is memory size to allocate contineouly (about 2GB). This 64-bit routine can expand the limitation up to whatever your PC has (now 4GB is just a standard in any 64-bit system). Other than that, this 64-bit routine works exactly same as this plugin. If data size is larger than 2 GB, this 64 bit routine can process much faster than the 32-bit routine. If data size is larger than 8 GB, this 64-bit routine is only way to process the data in this plugin.
References related to the PCA process
General references related to the PCA process:
- S.J. Gould, The Mismeasure of Man, Norton, New York, NY, (1996).
- P. Geladi & H. Grahn, Multivariate Image Analysis, Wiley, West Sussex, UK, (1996).
- J.T. Jolliffe, Principal Component Analysis, 2nd ed., Springer, New York, NY, (2002).
- E.R. Malinowski, Factor Analysis in Chemistry, 3ed ed., Wiley, New York, NY, (2002).
- P. Trebbia & N. Bonnet, "EELS elemental mapping with unconventional methods I. Theoretical basis: Image analysis with multivariate statistics and entropy concepts", Ultramicrosc., 34 (1990) 165-178.
- J.M. Titchmarsh & S. Dumbill, "Multivariate statistical analysis of FEG-STEM EDX spectra", J. Microsc., 184 (1996) 195-207.
- N. Bonnet, N. Brun & C. Colliex, "Extracting information from sequences of spatially resolved EELS spectra using multivariate statistical analysis", Ultramicrosc., 77 (1999) 97-112.
- J.M. Titchmarsh, "Detection of electron energy-loss edge shifts and fine structure variations at grain boundaries and interfaces", Ultramicrosc., 78 (1999) 241-250.
- P.G. Kotula, M.R. Keenan & J.R. Michael, "Automated analysis of SEM X-ray spectral images: a powerful new microanalysis tool", Microsc. Microanal., 9 (2003) 1-17.
- M.R. Keenan, P.G. Kotula, "Accounting for Poisson noise in the multivariate analysis of ToF-SIMS spectrum images", Surf. Interface Anal., 36 (2004) 203-212.
- M. Watanabe, D.B. Williams & M.G. Burke, "Atomic-Level Analytical Electron Microscopy of Diffusional Phase", in Proc. Inter. Conf. on Solid-Solid Phase Transformations in Inorganic Materials 2005 - Vol. 2, The Minerals, Metals and Materials Society, Warrendale, PA, pp. 431-442 (2005).
- M.G. Burke, M. Watanabe, D.B. Williams & J.M. Hyde, "Quantitative characterization of nanoprecipitates in irradiated low alloy steels: advances in the application of FEG-STEM quantitative analysis to real materials", J. Mater. Sci., 41 (2006) 4512.
- M. Bosman, M. Watanabe, D.T.L. Alexander, and V.J. Keast, "Mapping chemical and bonding information using multivariate analysis of electron energy-loss spectrum images", Ultramicrosc., 106 (2006) 1024.
- P.G. Kotula, M.R. Keenan, J.R. Michael, "Tomographic spectral imaging with multivariate statistical analysis: comprehensive 3D microanalysis", Microsc Microanal., 12 (2006) 36-48.
- P.G. Kotula & M.R. Keenan, "Application of Multivariate statistical analysis to STEM X-ray spectral images: interfacial analysis in microelectronics", Microsc Microanal., 12 (2006) 538-544.
- M. Bosman, V.J. Keast, M. Watanabe, A.I. Maaroof & M.B. Cortie, "Mapping surface plasmons at the nanometre scale with an electron beam", Nanotechnology, 18 (2007) 165505 (5pp).
- T. Yaguchi, M. Konno, T. Kamino & M. Watanabe, "Observation of three-dimensional elemental distributions of a Si-device using a 360-degree-rotation FIB/STEM system", Ultramicrosc., 108 (2008) 1603-1615.
